How you may navigate the tricky world of Junior Mining - with the use of a 'map'
It is important to understand that a junior mining project is constantly changing, and this has consequences for an investment decison. Day 1, Day 150 and Year 2 are very different as far as the knowledge, technicalities, requirements and risks of a project are concerned.
And so are the profit opportunities. This is sometimes difficult to cope with for beginners. In this article, I will provide a short life-cycle assessment of exploration projects, and what this means for investment decisions.
PUBLISHED SEPTEMBER 2024
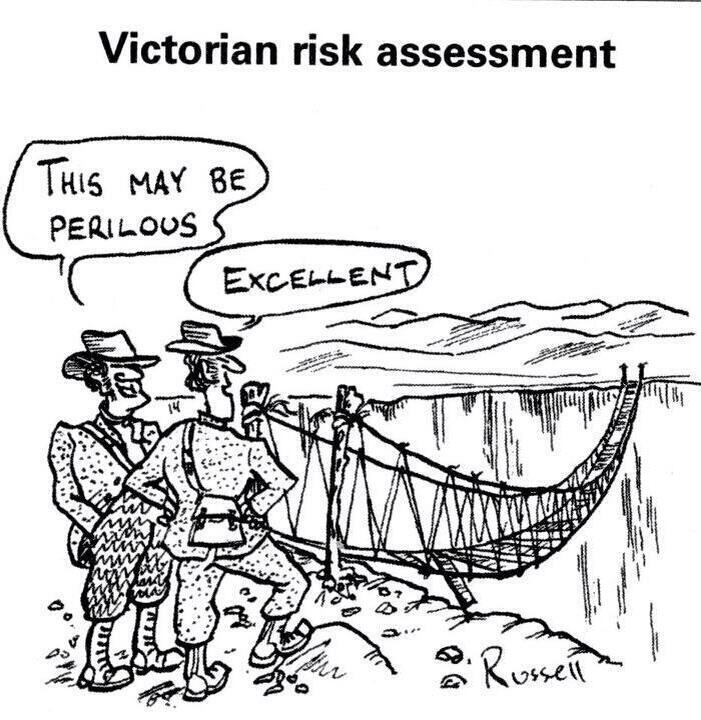
Different individuals have different tolerance levels for risk. It is however good if you know at which stage you should take into account which types of risks
Is the Lassonde Curve a good model for your investment planning?
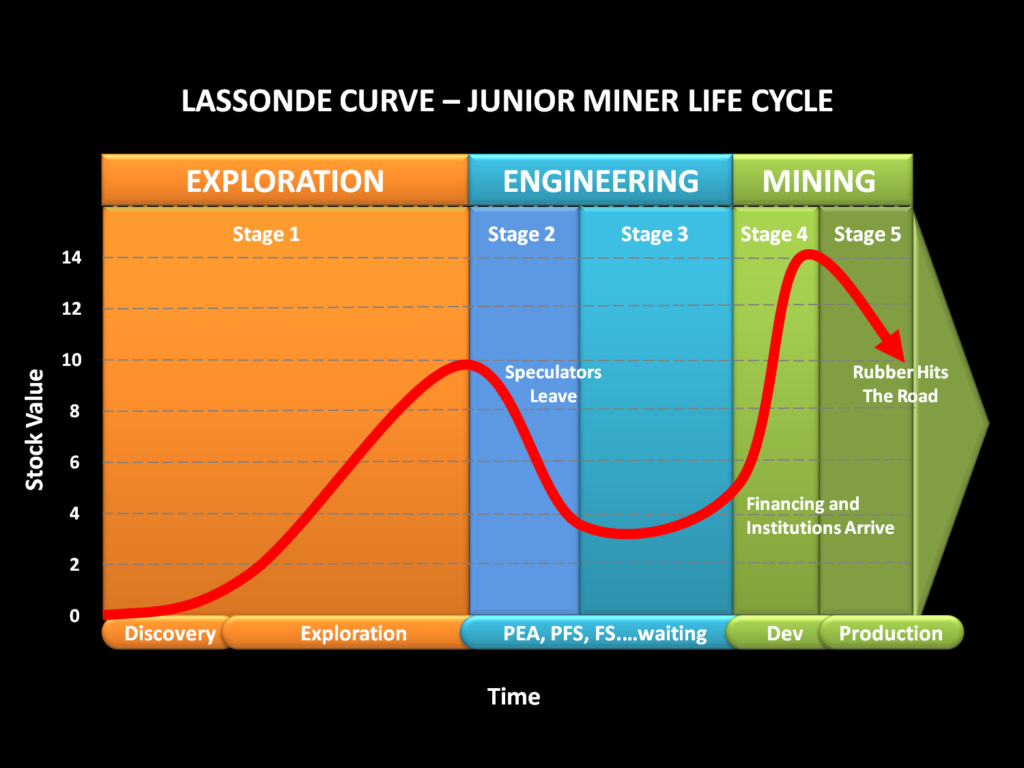
The life-cycle of an exploration project from start (first boots on the ground) to finish (a mine starts operating) has been transformed into a little piece of art by Pierre Lassonde, a Canadian mining investor. His now famous Lassonde Curve shows key development steps, time and value of an exploration project. Especially the development of value (and hence of the strock price) is important to understand for Junior Mining investors. Lets have a look at the curve beow:
(c) Kuchling Consulting
The two most important parameters of the concept are 'value' (vertical axis) and time (horizontal axis). We start at the left, at the exploration stage. This is normally where we as Junior Mining investors can be found. This is when geological, geophysical and geochemical testing is done, followed, in most cases, by drilling. Successful drilling should result in a 'discovery'. This, according to the curve is the climax of the exploration phase (end of Stage 1), and this is also the time when 'speculators' leave, resulting in a share price drop. Speculators leave when they want to cash in on their gains. What follows is the 'engineering' phase (stages 2 and 3). Here, the Junior Miner undertakes all the relevant technical studies (PEA, PFS and the bnakable feasibility study), and looks into the mine concept. The stock value finds its valley just before stage 4 begind, i.e. when the mine is being built. Let's look at another Lassonde curve example:
(c) Visual Capitalist
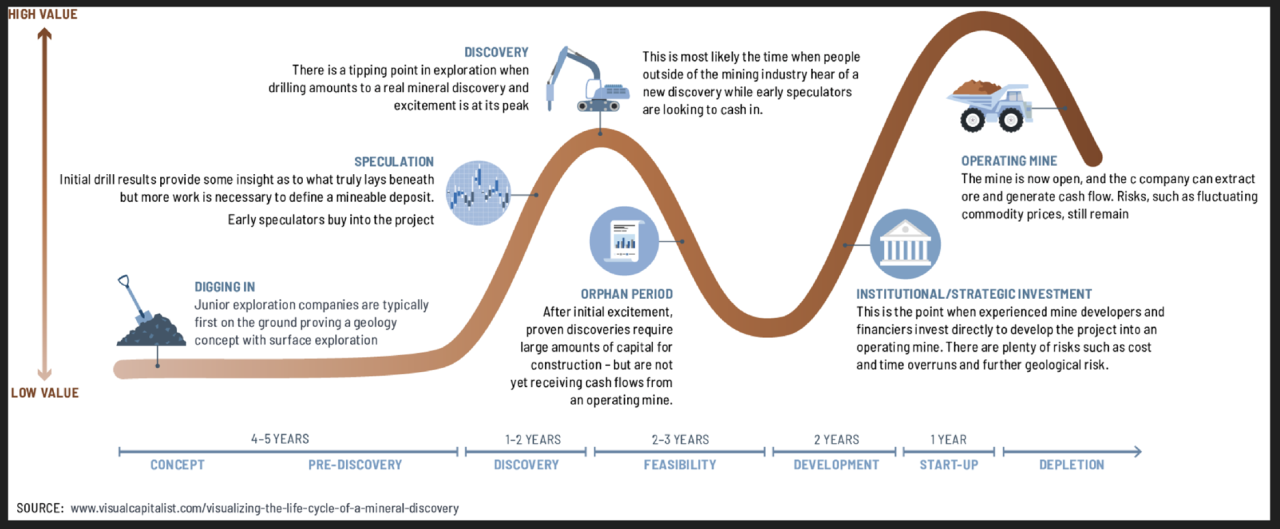
As you can see, this one provides a bit more detailed sub-segments below the horizontal axis (concept, pre-discovery etc.), but the course of the curve is in principal identical.Is this simplified? Yes. Can it help us to make investment decisions? I think so. Because in a way it seems to be a not-so-good idea to invest USD 25,000 right before the feasibility stage kicks in. On the other hand, the curve points out that that the greatest value creation and the greatest creation or growth takes place before discovery, and then again after the orphan period. In both phases, high profits are possible. But how realistic is the curve then, compared to real life? Let's look at some examples.
Example 1, Ophir Metals:
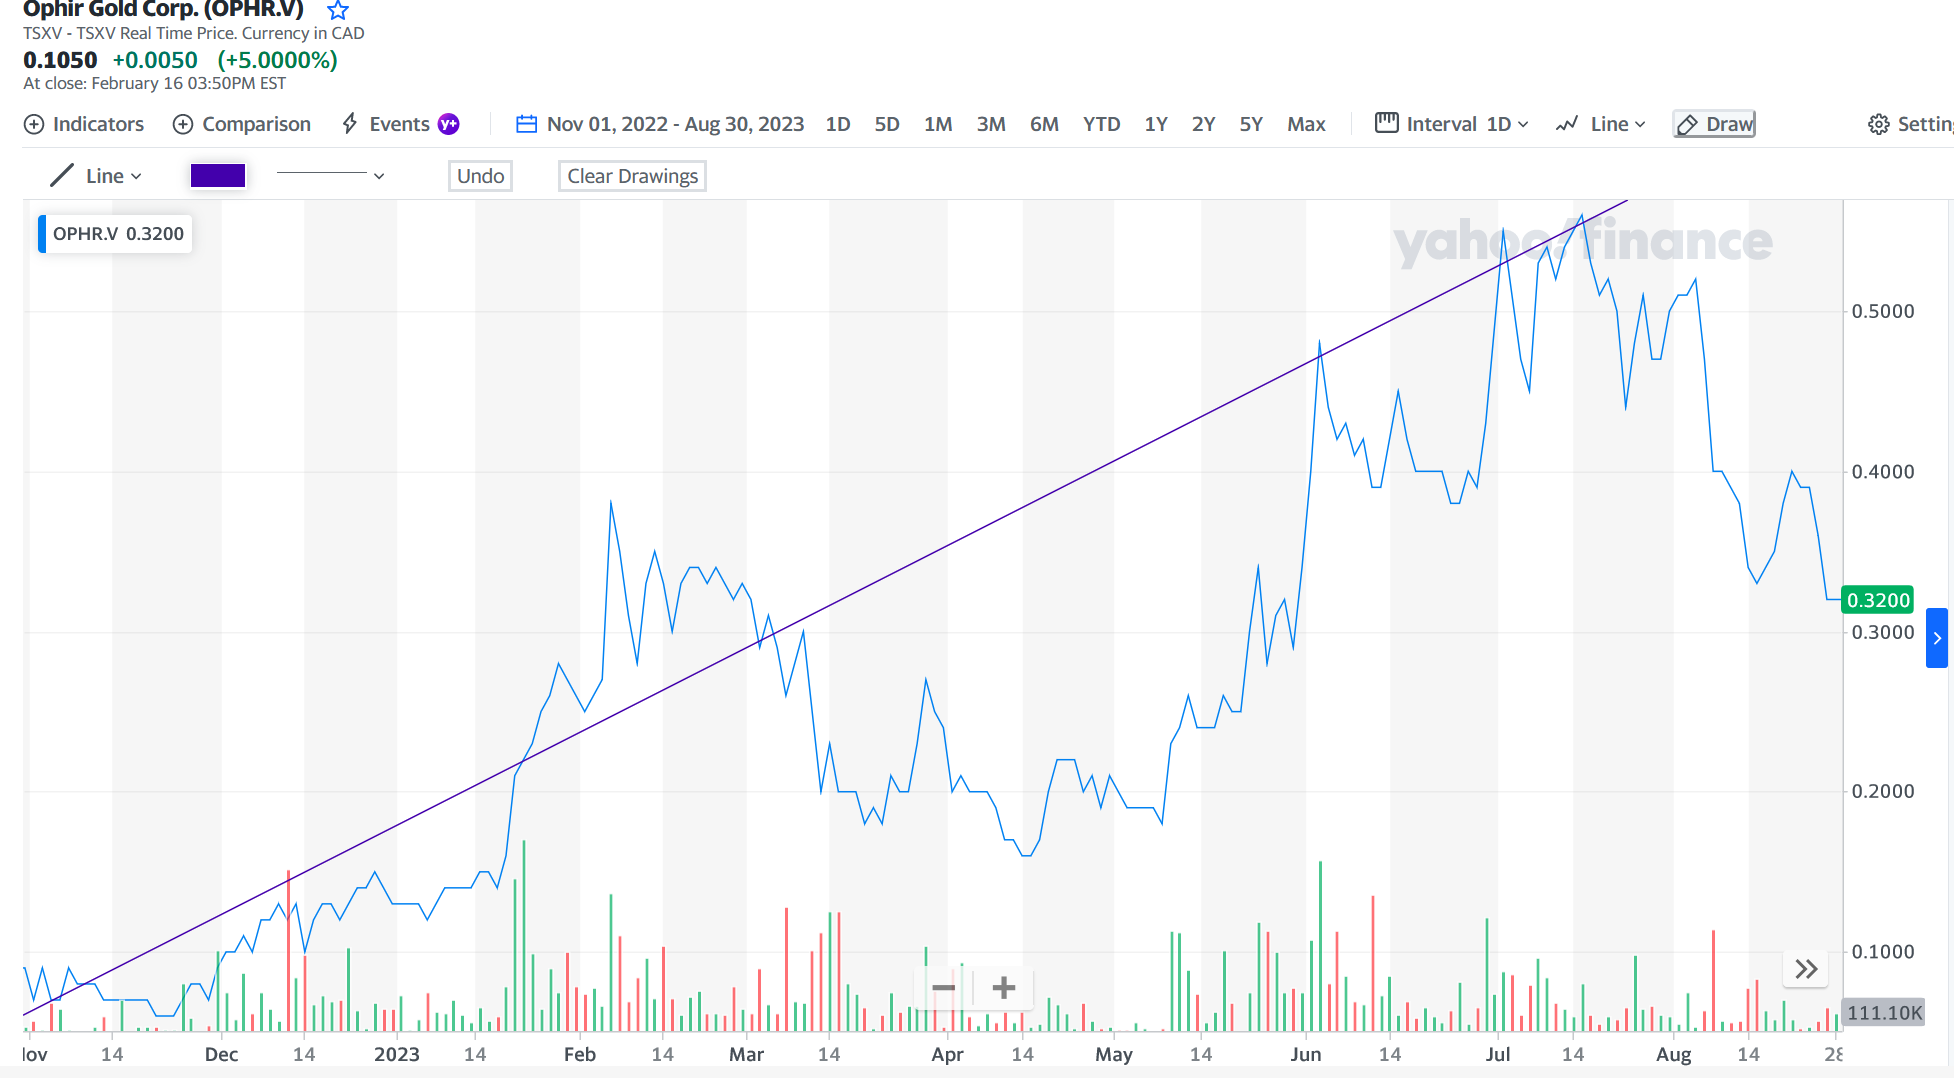
Share price development Ophir Metals November 2022 - September 2023
Side note: On the top left of the graph, you can still see this company under its old name, 'Ophir Gold'. It has changed to Ophir Metals in early 2024.
Ophir Metals is a lithium explorer which operates in Canada, and is by all means in the pre-discovery stage, ,i.e. at the left of the Lassonde curve.
From November 2022 to February 2023, the stock price of this lithium explorer has increased by more than 300 percent, and from November 2022 to August 2023, it has increased by about 600 percent. Even in between, there were some solid opportunities to earn money. For example, between summer and spring, approx. 200 to 250 percent were possible.
Looking at the chart, we see two growth centers or epicenters here, one between November 2022 and March 2023, and the other kicking in on summer 2023. Workwise, the first growth can be associated with the discovery of lithium prospects (by surface methods, i.e no drilling), and the second with geomagnetic surveys and other research work on the target zones.
Interestingly, the lithium market was also very 'hot' at that time, as you can see the graph below.
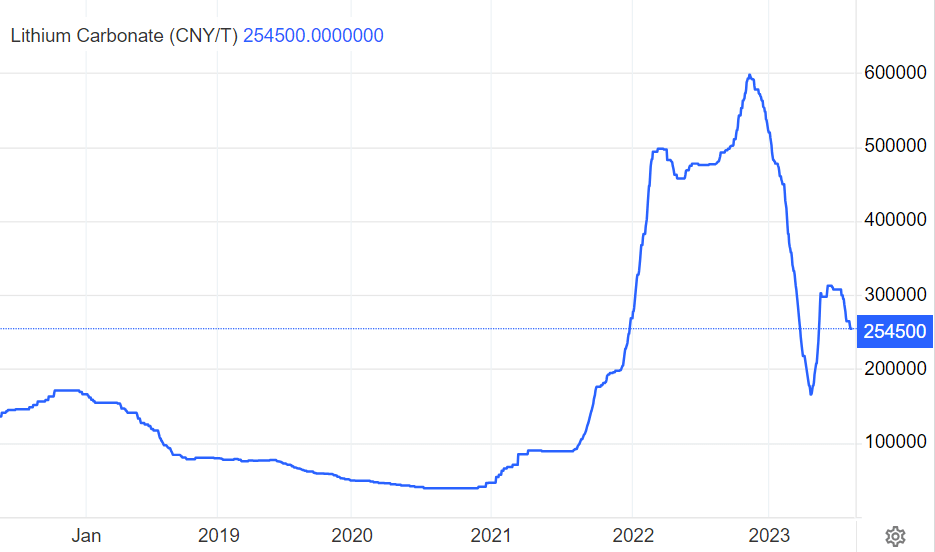
Weekly lithium spot price development 2019 - 2023 (c) investingheaven
Ophir's value journey seems to resemble what the Lassonde curve suggests. The phase of early exploration and pre-drilling can lead to substantial increases in market value and stock prices.That phase of course also is not short of risks: We know lottle about the project, especially as far as the size and composition of the 'mineral occurence' below the ground is concerned.
This is why, as I point out elsewhere, we should have some security measures built in:
- Good location; prolific for the metal in question; ideally some other explorers and/or operating mines (for that metal) nearby
- Historic drill data
- Top management team with proven track record
- Positive markets for the metal in question
Find out more about what you should look out for in a Junior Mining project:
Ophir Metals made full use of the strong lithium market sentiment of that time, and bought two properties in a highly prolific lithium mining district in Canada (James Bay).
Example 2: Lavras Gold
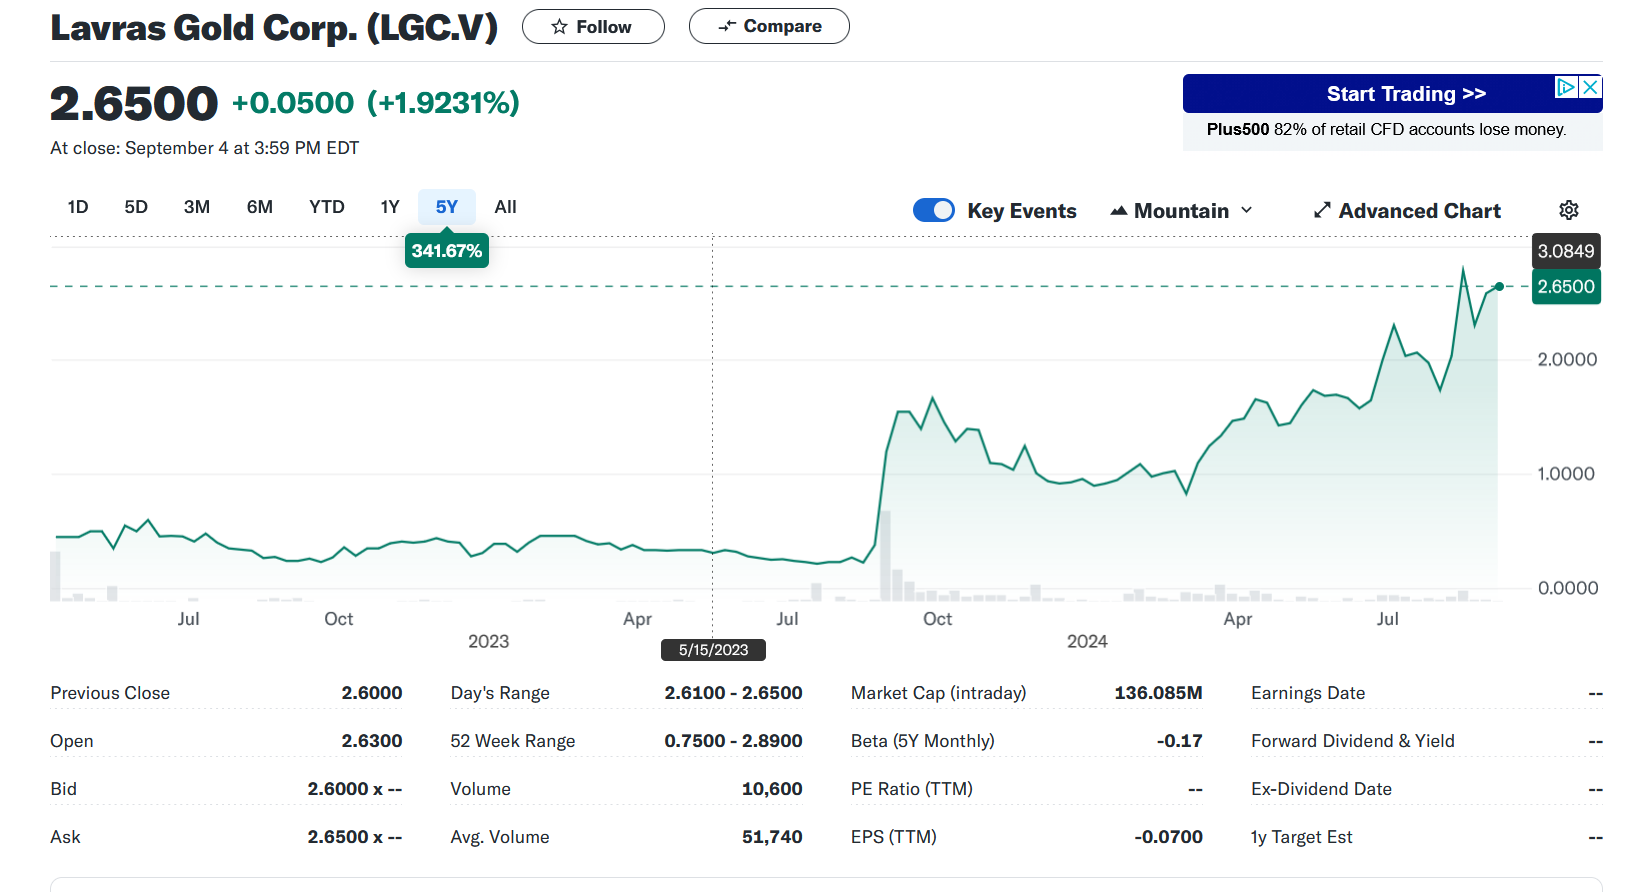
Chart share price development Lavras Gold, June 2023 - June 2024
Lavras's chart in a way does resemble the Lassonde curve even stronger, with a very flat left end, before spiking in late summer 2023, resulting in a 500% stock price increase within two weeks or so. Interestingly, there is a difference to the Lassonde curve, in that the time before the spike took place was not at all pre-discovery, since there were discoveries throughout 2022 already.
The two drill holes that finally led to the price increase were 350 meters at 1.09 g/t Au and then another 204 meters at 1.00 g/t Au in August and November 2023 respectively.
Risks on the other hand were limited, in my view if for example you came in in early 2023 when the signs of gold discovery were already everywhere (as you can see in the news section of this company). In a way, the section of Lavras we looked at above is still on the left side of the curve, around the discovery phase, or between at the right edge of the orange area in the first Lassonde curve. So the recent growth of Lavras underlines again the growth potential.
On the other hand, again looking at Lassonde curve No 1 above, we might be at the transition between orange and blue, i.e. at the beginning of stage 2 (upper Lassonde curve), or the 'orphan period' (lower Lassonde curve). So while the period before the 'big spike' still allowed entry (and indeed, with limited risk, as in my view such a pike was unavoidable, given the many good drill results over the last months), I personally would be hesitant to go in now, as the orphan period might be at the doorstep, opening up a phase of sluggish share price growth, or indeed shrinking prices.
Of course, the Lassonde curve is a concept, and one can not always exactly forecast price reactions, as wel will see when looking at the next and last example.
Example 3: NexGen Energy
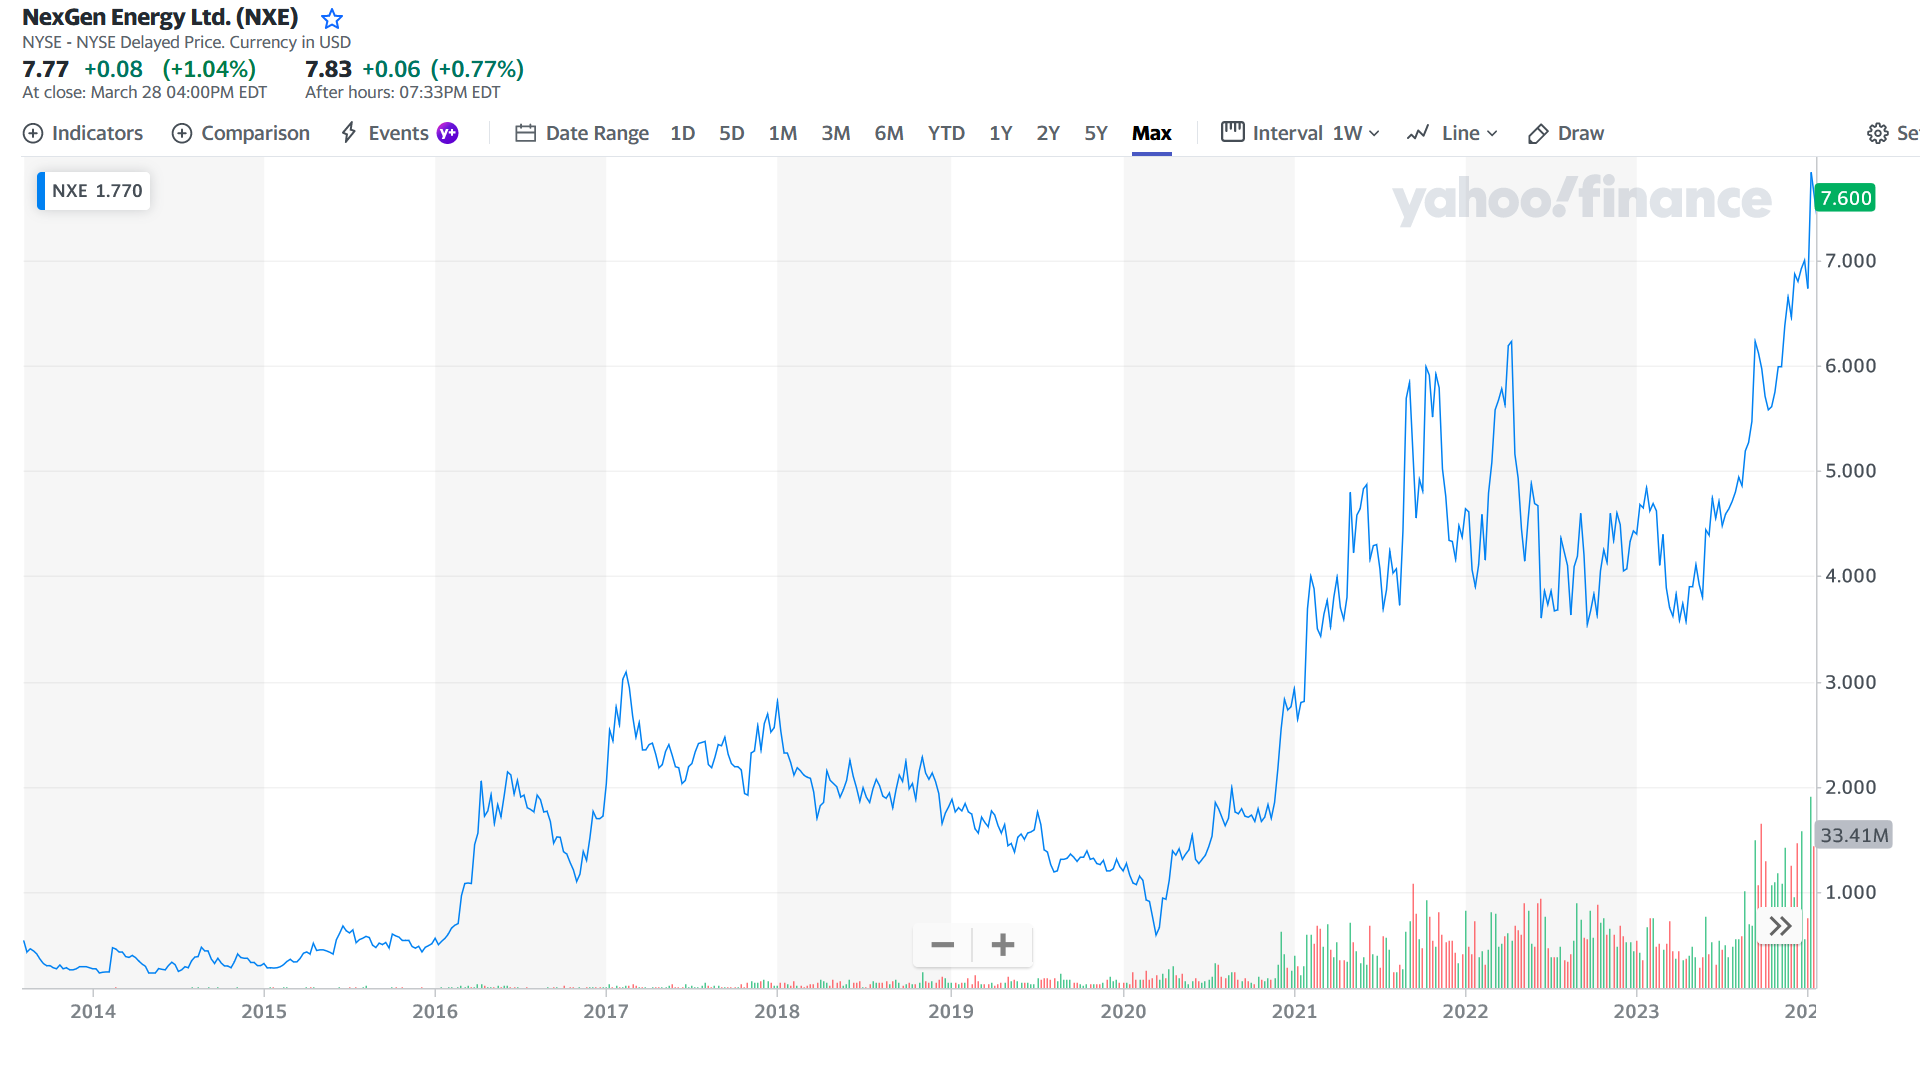
NexGen Energy stock price development 2014 - 2024
NexGen Energy is an uranium developer based and operating in Canada. It is a star in the exploration industry, as it discovered with Arrow I (in 2014)one of the largest uranium deposits over the last decades. I have put in a 10-year chart above as it serves as a good example again to make the point with the Lassonde concept.
Above, after the discovery of Arrow I, we can see the devlopment phase of the deposit between 2014 and 2017, when new discoveries and resources led to a continuous growth of the deposit. Hence, while the period from the very left of the chart until 2017 resembles the exploration area of the Lassonde curve, we also see that this is exceptionally long (basicall a 2,5 years long growth period).
Remember that for Lavras I said that I personally would be doubtful in putting in my money now, at the time of writing (September 2024), as we might be in the transition period between development and the orphan period. But as NexGenEnergy shows, it is not easy to agree ex-ante when that transition kicks in. The exitement with Arrow I was so big, that with every new successful drill result, new investors came in board, delaying the initial larger sell-off period until early 2017.
Stock prices declined from around February 2017 onwards, and the preliminary economic assessment (PEA) was publsihed in September 2017. While that is a milestone that can still lead to s share-price increase (if this study confirms the good results), this was not the case with NexGen, as the exitement phase was already very long, and most short or medium investors finally sold since they cashed in big already at that time.
Let's look at the next developments:
Between 2017 and 2020 we had pre-feasibility study, and definitive feasibility in 2021. Share price development is roughly in line here again with the Lassonde concept. We are right in the orphan period, or in the engineering phase. The initial investors have left, counting their money. No major surprises are normally expected at this time, so the term orphan perios seems appropriate.
The stock prices went back up again after 2021, until 2023.
In terms of risks, geological risks are limited at that time, but new risks around financing and permittting are coming up at this stage (i.e. risks that deal less with exploration, but already with the mine development stage). In our case, NextGen Energy hadn't a lot of problems to find financing, but permitting was still not clear.
This is also why we see kind of a second orphan period here. This is when all the technical studies have been completed, but permitting was not yet there.
NewGenEnergy then became fully permitted (and financed) in 2023, leading to a reviving of share prices are high again. This is between stages 3 and 4 in the upper Lassonde curve, or at the start-up phase in the lower one. Again, NexGen's development from here supports the concept of Lassonde.
Conclusion
Often, but not in all cases, the Lassonde curve can actually function as a kind of route map for exploration projects, and for Junior Mining investors.
It is important for investors to get an idea of where the project is, especially if you're new to the junior mining business. There are three or even four main phases. The early development or prospecting period, the exploration period until discovery, followed by the orphan period, as suggested by the Lassonde curve.
As in the example of NexGen Energy, I would also differentiate between the orphan period 1, which is when the technical studies are done, and the orphan period 2, which is when the permitting takes place. That one could take anything between 1, 2, 3 or even more years.
In terms of risks, these change - but the endeavour is never risk-free. We shift from more geologically-related risks to technical, to financial, to permitting. And this also means to look for other issues in the later phase than in the earlier phases.
Also the end of the orphan period should be seen as another great buying opportunity, just be aware that there might indeed be 2, not only one. In either of these, before you buy, check out the economics of the project (is there upside potential?), and also look at market risks: The metal has to be in demand, even in two or three years. Also, is it fully financed, and how realistic is it to get all permitting within an agreeable time (1-2 years max)?
The general question is, if you want to buy in both phases (i.e. early/advanced exploration, and after the orphan period), or if you want to decide between any of the two. One could aim to become a specialist in either. Without doubt, both require different knowledge. of course, one can also accumulate broad knowledge and buy during both phases.


https://shorturl.fm/CihQo
https://shorturl.fm/YIKIl
https://shorturl.fm/RnYXJ
https://shorturl.fm/5yw8l
https://shorturl.fm/ljC14
https://shorturl.fm/9MnBi
https://shorturl.fm/e6j4P
https://shorturl.fm/Yqm89
https://shorturl.fm/XhEi4
Boost your earnings effortlessly—become our affiliate! https://shorturl.fm/HLv4b
Drive sales, collect commissions—join our affiliate team! https://shorturl.fm/Dvdvf
Join forces with us and profit from every click! https://shorturl.fm/K1HN2
Join our affiliate program and start earning commissions today—sign up now! https://shorturl.fm/tPvDj
https://shorturl.fm/MVjF1
Very good https://is.gd/N1ikS2